Pages

Saturday, October 9, 2010

Daily Update: InTrade Data Suggests Republican House Gains Like 1994

Our analysis of InTrade data today will likely put an extra spring in the step of House Republicans.  Today's analysis projects that Republicans will hold between 228 and 233 seats in the next Congress.  The midpoint estimate of 231 would mean gains on election day of the magnitude captured in the 1994 election.  At the high end of our estimate (233), Republicans would hold the greatest number of seats since they entered the 80th Congress (1947) with 246 seats.  The probability of Republicans taking the House based on our model's evaluation of InTrade data stands at a midpoint estimate of 77.6%.

Perhaps the most striking aspect of the model's evaluation today is that it assigns a probability range of 34.1% - 38.5% with a median of 36.3% that Republicans will capture more than 60 seats in November. 

The question is whether markets are signalling the beginning of a major upward swing for Republicans or whether it is a temporary blip.

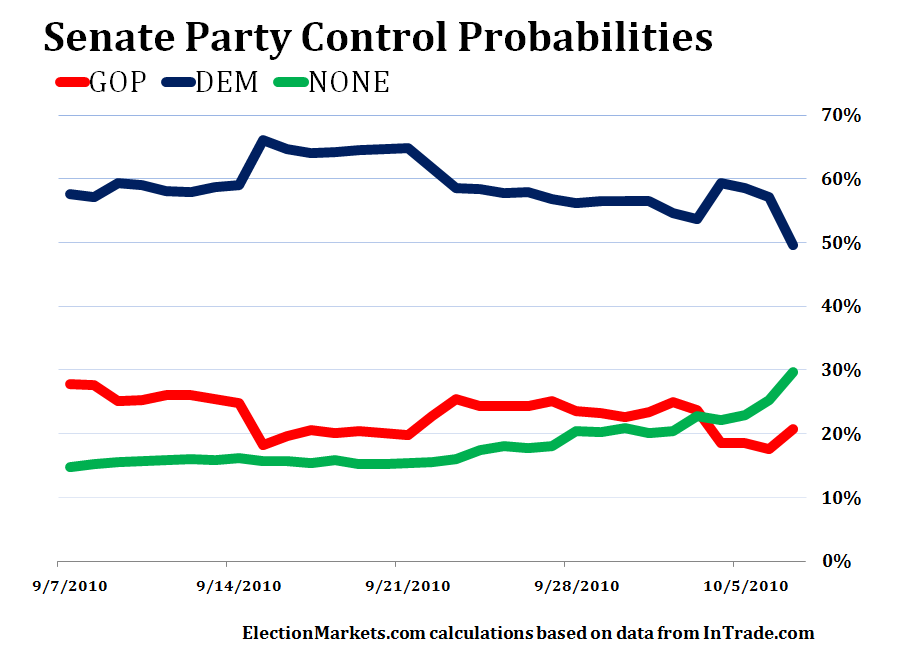
The Senate side of the ledger remains far more muddled.  While it had appeared that Democrats were well positioned to maintain control, the InTrade markets are becoming increasingly skeptical of their ability to hold onto control without counting Lieberman and Sanders. 


Our micro model pegged the likely Republican Senate seat count after the election at a median estimate of 48.2.  The macro model registed a much more bullish reading projecting a range of median estimate of 49.3 seats.

More tomorrow on the individual races, but today's reading reconfirmed our emerging theme that Illinois, Nevada, and Washington are the most likely states to decide which party control the Senate in the next Congress.  

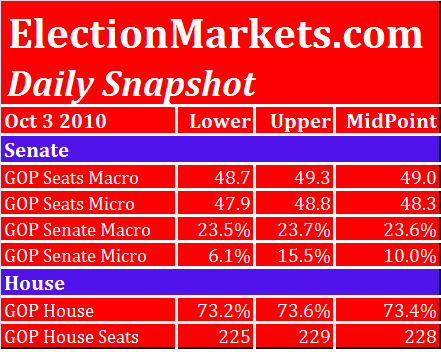
Our macro model assigns a 24.5% probability of Senate control by Republicans.  The micro version of the model assigns a median estimate of 7.4%.

OF NOTE --- Applying our final week screen to today's data with our micro (race by race) model yields a Republican seat count range of 50.0 - 50.2; and a probabilty of nearly 70% that Republicans will hold 50 or more seats.  Under this screen the probability of Republican control rises to greater than 33%

Friday, October 8, 2010

Weekly Update: Is Democratic Defense Cracking?

Is the Democratic line of defense cracking?  Are Republican prospects for controlling both Houses of Congress accelerating?  Or is this like the top of a bull market in stocks with one last Republican "buying spree"?

We obviously won't know the answer with absolute certainty for another 3 1/2 weeks, but market data gives hints of a looming collapse in market impressions of Democrats prospects for holding the House and perhaps the Senate.   

In the House, our model presently suggests that Republican prospects for House control have increased to over 75% and a projected seat total of 228 -- or a 51 seat gain from the 177 seats they held following the 2008 election.

On the Senate side our macro level model is pointing to Republicans holding 49.1 seats; our micro model is projecting a range of  48.0 to 48.9 seats. Both models still assign probabilities of under 25% for Senate control.

Commentary: Today's Employment Situation Report

At 8:30 A.M. the Bureau of Labor Statistics (BLS) will release its employment situation report for the month of September.  This will be the last look at the national employment and unemployment picture.  This report could have significant implications for the November elections.  (Since this post BLS reported that the unemployment rate was unchanged at 9.6% in September and that the economy lost 95,000 payroll jobs (64,000 private sector increase.)


Thursday, October 7, 2010

Daily Update and Commentary: The Tipping Point

The chart to the left illustrates the dilemna faced by Democrats at this point in the election cycle.  As I have discussed in prior posts, the InTrade contract does not count independents in determining control.  The clear implications of this chart is that the market is increasingly skeptical of Democrats ability to control more than 48 seats in the Senate when it convenes in January.

At the same time, the market is not expressing great confidence in the Republicans ability to control 51 seats (remember that under this contract, only a Joe Miller victory would accrue to the Republicans in determining control).

The trend in the Senate has clearly favored Republicans over the past month.   The question is whether of not that trend will accelerate over the next three weeks, sputter, or reverse.

The macro version of the model currently projects Republicans holding 49 seats after the election, while the midpoint estimate in the micro model is 48 seats.  

On the House side of the ledger, the Republican probability of control stands above 74%.   Republicans are clearly in the driver's seat according to market pricing.  The midpoint estimate of 226 seats would be an improvement of 49 seats from the 177 seats Republicans held after the 2008 elections.

Observers should recognize that at this point in the cycle we are likely to see the seat projection begin to show greater variance than the control probabilities where the House elections are concerned.

Pricing of contracts for projected House gains are suggesting that the risk in seat projections is greater on the upside for Republicans. 

Back to the Senate side ... As the following chart to the left illustrates, the shift in the expected distribution over the past month has been to the right (favoring Republicans) even with markets' discounting of Republican chances based on the Murkowski announcement of a write-in campaign and the negative perception of Christine O'Donnell's chances in Delaware. 

As noted yesterday, the pricing presently suggests that control of the Senate may likely come down to three Senate races -- Illinois, Nevada, and Washington -- but could quickly expand to include additional states like California. 

The following table -- outlines the current probability estimates in the 37 Senate races.


Wednesday, October 6, 2010

Daily Update: Markets Digesting Data

Today's data doesn't show any major movements although the probability of Republicans taking control of the House of Representatives did show a small uptick to 73.3%.  (Based on InTrade data).

At this point market and polling data suggest that a change in House control is significantly greater than continued Democrat control. 

While it is always dangerous to speculate, traders are likely to upgrade House Republicans chances over the next week should current generic ballot trends continue.  Democrats are quickly approaching the equivalent of needing to draw an inside straight in order to hold onto the House.

The Senate still poses significant challenges for Republicans (from a control perspective) but as I mentioned  this morning the path to control is becoming more defined.  Senate control could very well come down to whether or not Democrats can hold one of three seats (Illinois, Nevada, and Washington).  It's still too early to declare this as the Democrats "three seat firewall" but if the situation remains stable over the next two weeks, that is where we are likely to be a week out from the election. 

The Iowa Electronic Markets-- price the probability of a House Republican takeover at a slightly higher level of 78%.  Those markets also price a Republican Senate takeover slightly higher (22%).  There is no clear cut reason that easily explains the the House discrepancy, but the Senate difference likely results from the fact that IEM counts independents caucusing with Republicans or Democrats toward determining control.  InTrade does not.  In the case of the Senate the best example of this difference is how a Lisa Murkowski victory would be treated.  Under IEM she could be the 51st member counted toward control.  That is not the case under the InTrade market contracts.  Lieberman and Sanders count as Democrats for control purposes.

A word on poll averages ... while this is an extreme case when looking at poll averages observers should put a plus or minus 1% "uncertainty margin" on the reported spread.  Why?  Because polls are generally not reported with raw numbers, but with percentages rounded to the full percent.  The effect is that a margin of 45 - 44 could range from 44.5 - 44.4 (0.1 spread) to 45.4 - 43.5 (1.9 %) spread.  While the averages probably tend to cancel each other out, it is worth remembering when looking at narrow spreads in poll averages.

Path to 51: A Defined Path, But a Narrow One

While prediction markets do not presently give Republicans a very high probability of taking the Senate in the midterm elections, the markets do suggest that there is a clear path to that objective. 
Much may change over the next 26 days, but at this point Republicans have a 70-plus percent chance of capturing six seats presently held by Democrats (Arkansas, Colorado, Indiana, Wisconsin, North Dakota, Pennsylvania, and Wisconsin).
In two other states where seats are held by Democrats (West Virginia and Illinois), Republicans have a better than 50% chance of winning.
Winning all those seats would get Republicans to 49 seats.  The next two most likely wins for Republicans are in Nevada and Washington where Republican chances are above 40% -- certainly territory for real nervousness on the part of Democrats.  From a straight statistical standpoint, the Republican probability of Republicans winning both is about one in five.  However, that calculation assumes that the two races are independent events.  Clearly, in a trend election where there is a major wave in one direction or the other, the events are not totally independent.   For Democrats, the odds of winning both races are close to the odds of losing at Russian roulette on the first pull of the trigger.  Good odds, but catastrophic results if you lose – not a game you want to play.  Expect to see Democrats continue to pour resources into California and Connecticut in an attempt to purchase insurance.  The data suggests that they should be just as worried about the New York Special Election seat as they are Connecticut and California.
The same analysis that gives Republicans a 19% chance of winning in both Nevada and Washington, produces a 68% chance that they win at least one out of the two and get to 50 or 51 seats. 
Of course, this is highly speculative and will vary a great deal between now and November 2.  Point is a fairly defined path to 51 does exist.

Tuesday, October 5, 2010

Daily Update: Mostly a Sideways Day

Republican prospects for taking over the Senate retreated marginally, but both macro and micro models showed a slight, but insignificant, uptick in projected Republican Senate seats.

On the House side, the model shows Republicans with a nearly 73% chance of taking control of the House of Representatives.   In terms of Republican seats, the model produced one of its narrowest ranges this year, 225 - 227, with a midpoint estimate of 226. 

If current trends were to continue until election day, the micro version of the model shows Republicans holding 50.1 seats.  This puts Republicans on the cusp of gaining control of both the House and Senate.   Based on current data Republicans are in a far better position to gain control of the Senate than Democrats were at this point in time during the 2006 election cycle.

The Republican pathway to Senate control, or conversely the shape of the Democrat's "firewall", is becoming more clearly defined.   I will be discussing this in more detail over the next few days.

Charts are available after the break.  Click Read More to view.


Monday, October 4, 2010

Dems Regain Some Lost Territory, GOP Maintains Upper Hand

Republicans gave up a small amount of ground they had gained over the weekend, but remain well positioned to score major gains in the upcoming mid-term elections.  In the House, Republicans remain above 70% probability of control and are projected to hold at least 226 seats in the next Congress.   Of particular interest will be the impact on markets of today's Gallup generic ballot results -- Gallup's first read using their likely voter model.    (http://www.gallup.com/poll/143363/GOP-Positioned-Among-Likely-Midterm-Voters.aspx)


On the Senate side of the ledger, both the macro and micro models showed a modest improvement for Democrats.   GOP odds of controlling the Senate (based on the macro model) dropped below 20%.   Howerver, as noted previously, both our model and the InTrade contracts would not consider a win by Senator Lisa Murkowski as a Republican win. 

You can click on any of the charts below to enlarge them.


The following two charts show the current seat distributions in Senate races.  Click on them to enlarge.


Sunday, October 3, 2010

Sunday Night Special

An added Sunday night bonus graph. Graph depicts House model's GOP seat projections for next Congress.

Sunday Afternoon Update

GOP House Seat Estimate +1 to 228.  GOP Senate Seat Macro Estimate +0.1 to 49;  Micro Estimate +0.2 to 48.3.  House GOP Control Probability at 73.4%.

With GOP win probabilities exceeding 40% in 28 of 37 races Senate control is within striking distance.  Easiest path to 51 goes through Illinois, Nevada, Washington, and West Virginia.  GOP over 50% in 2 of 4. GOP wins in all four would likely mean Senate control.

At this point GOP win probability exceeds 70% in 24 of 37 races; Dem win probability exceeds 70% in only 8 races.  Daily charts follow. 


For a detailed table of probability estimates for individual Senate races see the table below