Pages

Wednesday, October 24, 2012

Obama Looking for a Real Recovery

While this applies to the recovery America has experienced courtesy of the President's economic policies, the bulk of this post applies to our models.

But let's look at the economy for minute. Economic growth a total of 6.7% since recession ended three years ago. Average of other recoveries was 15.2%. Lost output in real terms $1.1 trillion. And that gap will grow when GDP is updated on Friday.

Back to the election. Obama improved from our morning post. But on ou state based model his improvement was modest. It was modest enough that the Obama cheer leading squad would call it statistical noise if it was a gain for Romney.

Anyway our model puts the race at 277 Obama 261 Romney. Obama is in trouble if the current trend continues. While Romney's advance has slowed after his sharp post 1st debate advance, the underlying trend continues albeit at a slower pace. The pace is sufficient under our model to result in a Romney victory.

Our state based model currently projects Obama 277 Romney 261.

Senate news over the last 24 hours has focused on Indiana. While the Indiana data suggests a decline in GOP prospects it did not change our model's projection of 49 Republican seats.

Charts are posted below.


Are Markets About to Make Romney the Favorite?

Special Morning Update:  Updated data used in the ElectionMarkets Presidential race models.  The state based simulation shows Romney at 266 electoral votes to the President's 272.  (Distribution of outcomes chart posted below.)  Romney won in 44% of the simulations.  The most frequently observed outcome was 268.

As I have explained previously the model forecast is the median forecast.  Significantly, on the maximum price point Romney garnered 273 electoral votes.  This is the model's first showing of more than the magic 270 for Romney at any of the pricing points.  The low end price point showed Romney with 259 electoral votes.


For the last several days, I have given a chart that tracked our model estimates with Nate Silver's fivethirtyeight.com fore and now casts.  Here is how they stack up as of last night.  The ElectionMarkets model doesn't paint as pretty of a picture for the President as Silver's model does.


Tuesday, October 23, 2012

Romney March to 270 Continues

Romney moved closer to victory on all our metrics today.

Our macro model shows President Obama's probability of reelection dropping to 56% today.  The President's electoral vote count under our macro model dropped to 280. 

However, our electoral vote count under the state based model showed the President's position continuing to erode.  Our current assessment shows the President's advantage dropping to 275 - 263.  Here is our chart of the distribution of our results after simulating the election ten thousand times.

Most disturbing for the Obama campaign is that for THE FIRST TIME OUR MAXIMUM PRICING POINT SHOWS MITT ROMNEY GETTING 270 ELECTORAL VOTES.

Several weeks ago when the Obama campaign was riding high we raised the question of when the Obama bubble would burst.  Without question, the bubble has burst.  The question is if the Obama campaign can reverse the Romney momentum. 

While the President maintains a slight advantage under our models, THE TREND IS NOT OBAMA'S FRIEND.  For a number of days we have compared the results of our state based model with those of Nate Silver at his New York Times blog fivethirtyeight.com.  While fivethirtyeight has shown the President halting Romney's momentum, we find no evidence that is true.

We will post an updated chart comparing our results with those of fivethrityeight when Nate updates his model.

While the race for President is foremost in the mind of citizens, the race for control of the United States Senate is of great significance.  Our state based model currently projects Republicans with 50 seats after the election with a range of 49-50. 

Little Change the Morning After

President Obama failed to gain any traction from last nights debate. Our macro model's win probability measure actually saw the President's standing decline. His probability of reelection on this measure has dropped to 58%.

Our state based micro model has the President garnering 278 electoral vote to 260 for Mitt Romney. That is a move of 1 electoral towards Obama.

To put some perspective on the magnitude of Romney's recent gains, since the first debate. On October 2 our model reading was Obama 316 Romney 222. Romney has gained 38 electoral votes since then. Will the momentum continue? At least for now there is no indication that it will not

Monday, October 22, 2012

Obama Standing on Edge of Cliff

Tonight’s debate may well signal the outcome of the Presidential election. President Obama is standing on the edge of an electoral cliff. Unless he emerges with a resounding win, not just on debating points, on the underlying substantive issues, his reelection bid is doomed.

Unlike Nate Silver’s model at fivethirtyeight.com, the ElectionMarkets models have showed the President’s standing continuing to slide. Our latest read on the election using our state based modeling of InTrade data shows the President dropping below 280 electoral votes to a narrow advantage of 277 – 261. Prior to the first debate the model showed the President with 313 electoral votes.

More troubling for the President is that for the first time, the model has one of the four most frequently observed outcomes showing a Romney win with exactly 270 electoral votes.

The other three top outcomes out of 10,000 simulations of the elections have Romney at 257, 263 and 264.

The macro based model has the President’s reelection probability at 61% and on a downward trajectory.

The models do still show the President with a slight advantage. But the President’s task is large. The markets, as John McCain learned, will react quickly and with a vengeance if the President does not halt the Romney momentum. Mitt Romney still has work to do, but is in an enviable position where the trend is his friend.

Charts and updated analysis will be posted tonight after the debate.

As a side note, we had a marginal change in our state based Senate model which now projects Republicans emerging with 50 Senate seats. The range is now 49-50

Saturday, October 20, 2012

Romney Still Advancing. WillSlow and Steady Win the Race?

Posted a brief comment earlier today pointing out that our state based model unlike the 538 now and fore casts hadn't yet shown any halt to Romney's momentum.

After updating our data, our State based model has Romney gaining another electoral vote cutting the President's advantage to 280 to 258.
The most frequent result had Romney with 263 to Obama's 275. Posted below is our distribution chart and a chart comparing our model's results with those generated by Nate Silver at FiveThirtyEight.

Our macro model has the President's win probability dropping back to the pre-second debate level of 62%.

Our Senate forecast remains stubbornly fixed at 49 Republican Senators with a range of 48 - 50 seats for the Republicans. Our State based model still gives Republicans more than a 40% chance of ending up with 50 or more seats.

Friday, October 19, 2012

538 vs. Election Markets: We Don't See the Bounce Yet

Over the last few days, Nate Silver's FiveThirtyEight forecast and now vast have shown the President beginning to make a comeback.

Our state based model that uses InTrade data hasn't seen one yet. Here is a comparison of our results since the first Presidential debate.

A lot can and will change over the next two weeks, but here's what it looks like as of last evening.

The Post-Debate Bounce that Isn't

Yesterday we commented that our models showed the President with a quite modest one day bounce.

Our macro model saw the President's win probability rising to 65% from 62% on Wednesday evening. Our Thursday night update has that probability dropping back to 62%.

Prior to the debate our state based simulation gave the President a 282-256 electoral college advantage. On Wednesday evening we showed the President ticking up two electoral votes to 284. Our Thursday night model run puts the race at Obama 281 Romney 257.

Markets may change their views based upon upcoming events and new polls. Therefore we won't go as far as calling this the bounce that wasn't. For now we wii dub it "the bounce that isn't"

In the coming days we'll discuss some ancillary aspects of our micro model. Briefly, the model actually generates a range of implied probabilities for each state. The number we use for our comments use the median probability estimate.

We also run the model at the minimum and maxim price estate. In the last couple of days Romney's electoral vote count has exceeded 260. Today Romney clocked in at 263 electoral votes using the high end estimates and 251 at the low end.

The bottom line: our state based model continues to move incrementally toward Romney.

Our Senate model continues to be remarkably stable putting Republicans at 49 seats after the election with a range of 48-50.

Thursday, October 18, 2012

Models Showing Limited First Day Post Debate Bounce for the President

Throughout the evening and much of today, the twitter world was talking about the big bounce President Obama was getting in InTrade markets.

Our models show a slight uptick for the President, but the question is whether it represents a reversal of the trend or simply a pause in Mitt Romney's momentum.

Prior to the debate, our macro model showed the President with a 62% chance of re-election. Our state based micro simulation model pegged the President's electoral college advantage at 282-256. The most frequent outcome of the simulation was 275-263. Twenty four hours after the debate, the President's probability of victory on our macro model has increased to 65%.

Our state based micro simulation model showed the President's advantage in the electoral college at 284-254 -- a gain of 2 electoral votes since the debate. The most frequent outcome in our simulation was Obama winning 281-257.

The key question is whether this is a new inflection point in the race or merely a pause in the prior trend toward Romney. Overall, we would characterize the markets as giving the President a modest, but small gain post debate.

Our Senate simulation model continued to remain quite steady and projects Republicans with 49 seats. The range using our various pricing scenarios is 48-50.

You can see our charts on electoral vote distribution and Senate probabilities below.

Tuesday, October 16, 2012

Ready, Set ...

Pre debate micro simulation
Median. O 282. R 256
Most Frequent. O 275 R 263

Macro. Probability win O 62%

Win Debate. 845 pm O 60.3%

Monday, October 15, 2012

Race Stable With Debate Looming

As political pundits prepare their debate analysis and campaigns ready their spin games, markets have taken a break. They too are waiting to see if President Obama is able to stop the Romney momentum.

ElectionMarkets will update our database before the debate so we can look for any signs of another inflection point in the race.

But on the night before the debate here's what our analysis of InTrade market data is saying.

President (macro model)
Probability of victory. O 62% R 38%
Electoral Votes. O 290 R 248

President (state based micro model)
Electoral Votes. O 285 R 253

Senate. Republican seats 49. Probability of 50+ 44%. 51+ 25%.

How Big Was Romney's Post-debate Bounce

The chart below shows how much the simulation shifted toward Romney from October 3 through yesterday.

Updated numbers later tonight.

Sunday, October 14, 2012

Waiting for the Debate

Key numbers of the day
Bills 19 Cardinals 16. OT. 2 Byrd INTs key Bills victory.

President
Macro model O 292 R 246
Probability of win. O 62% R 38%
State based micro model O 283 R 255

Senate. 49 Republican seats

Saturday, October 13, 2012

The Biden Bump? Markets Can't Find One

If VP Biden stopped the bleeding for his boss, the InTrade markets evidently didn't get the memo.

While there isn't any polling data yet to determine if the Veep fired up the base, our modeling of InTrade data suggests that the President's electoral position continues to deteriorate.

Macro Model

Our macro model evaluates top line InTrade data to measure the state of the race. The probability of the President winning reelection declined to 60% in tonight's data run. This is down from nearly 80% a couple of weeks ago. On the electoral vote count the President's advantage has declined to 295-243. This represents a decline of 25 electoral votes from our Pre-debate reading on October 3 when the President held a 320-218 advantage.

State Based Micro Simulation Model

The deterioration of the Obama position is especially pronounced. Before the first Presidential debate, the President held an advantage of 313-225. Tonight's data run shows the President's advantage down to 283-255 -- a gain of 30 electoral votes for Mitt Romney.

Most encouraging for the Romney campaign is the fact that his gains have been powered by improving swing state prospects. Romney has gone from underdog to favorite to varying degrees in Colorado, Florida, and Virginia. Romney has also narrowed significantly the President's probability of victory in Ohio and Iowa. In both Iowa and Ohio the President's probability of winning the State has dipped below 60%.

You can find the electoral vote distribution of our simulation as well as a table showing estimate of Romney's probability of victory in each State.

A Brief Look at the Senate

Our state based simulation model has been relatively stable showing a median estimate of a two seat pickup bringing the Republican Senate count to 49.

Our model looks at a generates a range of probabilities in each State. At the low end of the pricing model Republicans would end up with 48 seats. At the upper end the model shows a 51 seat Republican Senate. This represents no change at the median and low points of the pricing range. The high end estimate of 51 represents a gain of one seat from yesterday.

The cumulative distribution of Republican seat outcomes is shown below.

Thursday, October 11, 2012

Quick Take on NBC/WSJ/Marist Ohio Poll -- A MORE Democratic OhioElectorate than 2008?

The partisan split of this poll is even more Democratic than the 2008 electorate. The table below show the partisan makeup of this poll as well as the 2004 and 2008 Ohio electorate. A second table shows the outcome under various partisan make-ups of the electorate using the polls internal numbers for partisan voting blocks. The graphic compares the result based on partisan composition of the electorate. If the partisan leanings of the electorate are as Republican as the 2004-2008 electorate, Romney would carry Ohio based on this poll's internal numbers.

Romney Momentum Continues

I mentioned earlier today that Mitt Romney's post-debate momentum under both the ElectionMarkets Moscow and micro models appeared to continue in Wednesday's trading. In the final analysis it did.

As of Wednesday evening our macro model has Obama 295 Romney 243 -- unchanged from Tuesday evening. Romney's probability of victory rose slightly to 37.6%.

However on our State based micro simulation model Romney continues his advance. Our Wednesday night read has the race at Obama 287 Romney 251. This represents a gain of 4 electoral vows for Romney from yesterday's 291 - 247 Obama advantage. Romney wins 24.9% of the simulations. The chart below shows the distribution of outcomes.

The state-based model of Senate contest shows Republicans emerging from the election with 49 Senators unchanged from yesterday. The probability of Republicans emerging from the election with 50+ Senators rose to 48.1%.

Wednesday, October 10, 2012

Another Down Day for President Obama

News from Gallup of a Romney +2 among likely voters shook up markets with Obama's re-election probability dropping below 60% for a brief period on Tuesday afternoon. Our pricing model showed a late afternoon early evening rebound to 63.1%.

Romney's momentum in our two Electoral College models continued. The macro model currently gives the President 295 electoral votes to Romney's 243. This represent a gain of eight electoral votes over the last 24 hours.

Romney's gain in the state base micro simulation model clocked in at plus 6 with the President leading 291-247 down from 297-241 on Monday.

The Senate micro simulation model's results were largely unchanged from Monday projecting 49 Republican seats. The probability of 50+ Republican seats came in at 41%.

Stay tuned for more details on the range of results produced by the State based simulation model and what it is saying about the race for President at a more granular level.


Tuesday, October 9, 2012

President Senate Update 10-08

The numbers and a couple of quick observations.

President.
Macro Model
Probability of Victory
Obama 63.9%
Romney 36.1%
Electoral Votes
Obama 303
Romney 235
Micro Model (State based)
Electoral Votes Median
Obama 297
Romney 241
Electoral Votes Most Frequent
Obama 294
Romney 244

U.S. Senate Micro Simulation
Median estimate 49 Republicans
Most frequent 49 Republicans
Note: Probability of 50+ Republicans approximately 40%.

One interesting question over this week will be how Gallup releasing likely voter tracking impacts perceptions. Another will clearly be how voters perceive VP debate. Unlike 2008, voters have not been conditioned to dismiss Ryan in the way they were conditioned to dismiss, unfairly in my view, Sarah Palin.

Sunday, October 7, 2012

Romney Surge Continues

The post-debate surge for Mitt Romney in election markets continued through Saturday.

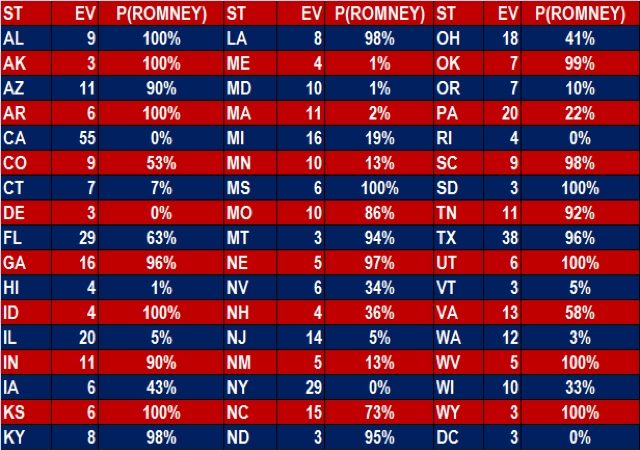
The surge is particularly evident in a number of swing states. For example, Florida has flipped to a slight Romney edge in the ElectionMarkets pricing model. And the gap has narrowed significantly in other swing states. (See table below.)

The momentum did not appear to be halted by the convenient news that the unemployment rate had dropped to 7.8% In September. It remains to be seen what if any impact this news will have on the Romney momentum.

Perhaps the timing leaves the public skeptical. Or perhaps the broader measure remaining at 14.7% informs the public that any improvement is small.

Of course if the labor force participation rate had not declined since Obama's inauguration in January 2009, the unemployment rate would be 10.7%. And the employment population ratio has only increased
by 0.5 percentage point from its cycle low.

Romney has picked up ten electoral votes in the macro based ElectionMarkets model and 20 electoral votes in the state based micro simulation model (table below). The macro version has Romney at 228 electoral votes, while the micro simulation puts his total at 245.

It will be interesting to see if this surge continues over the next week. If the Obama campaign does not stem the tide, the markets may reevaluate their current judgement that the President is still the favorite.

Democrats remain the favorite in the race to control the Senate albeit a narrow one. The ElectionMarkets state based model presently estimates Republicans capturing 49 seats.

The model is somewhat sensitive to changes at the Presidential level.

It would not take much movement to shift market perceptions toward the GOP. The model suggest that the seats that observers should watch closely include: Arizona, Connecticut, Massachusetts, Montana, Virginia, and Wisconsin.

The seats where Republicans can benefit most from continuing growth in enthusiasm for the Presidential ticket are Arizona, Montana, Virginia, Wisconsin.

Markets have not yet bought fully into Linda McMahon's strong campaign, but they are beginning to notice.

Thursday, October 4, 2012

Election Markets: Pre vs. Post Debate


Romney Shows Positive Movement in Key Battlegrounds

Political pundits agree widely that Mitt Romney outperformed President Obama in last night’s presidential debate. Flash polls and focus groups agreed with that assessment. In fact, the margin of people believing that Romney had bested the President was quite large.

It remains to see whether last night’s debate had any effect on voter intentions and moved the polls nationally and in key battleground states. It will be a number of days before we see polls that fully encompass the post-debate timeframe.

Further complicating any analysis is the Bureau of Labor Statistics’ (BLS) release of the September employment situation report on Friday at 8:30 a.m. Depending on the news, the report may serve to accelerate movement towards Romney if the report is viewed as “poor” or serve to stem any tide if the report is viewed as a “good” report.

InTrade markets suggest that last night’s debate did indeed move the race marginally in Romney’s favor. Remember, this is without the benefit of any post-debate horserace polling.

Since the debate, Romney’s position has improved in both the micro and macro versions of the ElectionMarkets’ model.

While Obama retains a solid advantage at this point in both models, the one day shift is significant. As intriguing as the topline shift is, the movement in selected battleground states is telling. The following table shows the change in Romney’s pre-debate and post-debate probability of victory in selected states.

Note that the President still maintains an advantage in all of these states except North Carolina, but the narrowing of the gap will be significant if the trend continues.

Friday, September 28, 2012

Flash Update

Current Presidential Model Results

Micro. Obama 318. Romney 220.
Macro. Obama 321. Romney 217.

Current Senate Model Results

Republican Seats
Median. 49
Most Frequent. 49

Probabilities

49+. 61%
50+. 41%
51+. 24%

Wednesday, September 26, 2012

NYT/CBS Q Polls Still Looking for Big Democratic Tilt


Looking Behind the Numbers in Florida and Ohio

Yesterday we examined a Virginia poll of likely voters from Virginia that was recently conducted jointly by the New York Times, Quinnipiac, and CBS News.  We noted that President Obama’s lead in that poll was predicated on an electorate that was even more heavily Democratic than indicated by 2008 exit polls.  In fact, if you recalculate top line results for that poll based off of the internal partisan indicators then Mitt Romney would be leading in Virginia unless the electorate is almost as Democratic as it was in 2008. 

Today, we’ll do an abbreviated version of that exercise for the new NYT/CBS/Q polls released for Florida, and Ohio.   WE ARE NOT ARGUING THAT THE PARTISAN MAKEUP OF LIKELY VOTERS IS DEFINITELY INCORRECT, BUT SUGGESTING THAT THEY RAISE INTERESTING QUESTIONS ABOUT HOW THE LIKELY VOTER MODEL IS CONSTRUCTED AND WHAT QUESTIONS THAT APPROACH RAISES.

Our view is that at the present time polling suggests that under a scenario where the electorate looks like 2008, President Obama would win if the election were held today.  If the electorate looks like 2004, then a Romney win is probable.

FLORIDA   NYT/CBS/Q Poll Obama 53 Romney 44

The following table pretty much says it all. In this poll Democrats hold a 9 percentage point edge in the pool of likely voters.  This compares to a Democratic advantage of 3 percentage points in 2008 AND a Republican advantage of 4 percentage points in 2004. 


Another way to look at this is the ratio of Democratic voters to Republican voters.   The poll suggests that there will be 1.33 Democratic voters for every Republican voter.  In 2008, the ratio was 1.09.  In 2004, it was 0.9.

Now this does not mean that President Obama is losing Florida.  It does suggest that a nine point advantage for Obama is highly unlikely here is what the race looks like at various partisan makeups.  The bottom line is that if Likely Voters were weighted to look more like 2004 than 2008, Romney would be leading in the poll.

A couple of other items jump out when looking at this poll’s internals.  While you have to be careful when looking at population subgroups based upon the sample size, here are a couple of interesting numbers that might seem inconsistent with the poll’s top line numbers.

·        Romney leads among Independents by a margin of 49%-46%.

·        Obama leads among Hispanics 55% - 41%.

·        Paul Ryan is viewed more favorably (38%-32%) by Independents than Joe Biden (37%-47%).

·        By a margin of 56% - 39%, Independent disapprove of President Obama’s job performance.


OHIO   NYT/CBS/Q Poll Obama 53 Romney 43
Similar to Florida, the composition of the electorate is critical to how you construct the pool of likely voters is critical.  In Ohio, a 2004 type electorate would move this in Romney’s direction.


This likely voter poll is slightly more Democratic than the 2008 electorate -- +9D vs. +8D.  The 2004 electorate was +5R.  The ratio of Democrats to Republicans in the poll was 1.35 to 1 vs. 1.26 in 2008 and 0.88 in 2004.  Small difference, but still more Democratic than 2008 voters.

Here are a couple of other interesting tidbits in the polls crosstabs.
 
·        Romney leads 47%-46% among Independents in this poll.
·        Obama leads by 60%-35% among women, Romney by 52-44% among men.
·        Among white voters Romney leads 49%-46%; 57%-40% with white men, and trails 53%-42% among white women.


Of course, party identification is not the only issue that can influence a poll’s outcome.  Other demographic factors such as gender, race, age and marital status can have a significant impact.  This is not to say the data behind the polls is wrong, but to remind readers that the interpretation of the data is also a major factor.
We won't know who is right until Election Day, but there is no question that the NYT/CBS/Q polls have a more generous view of this year's electorate for the President than even the 2008 turnout would justify.


Tuesday, September 25, 2012

Will the Obama Bubble Burst?


Are Prediction Markets Underestimating Extent of Obama’s Tail Risk?


Prediction markets like InTrade have proven to be good predictors of electoral outcome over the past several election cycles.  But the view six weeks prior to an election is not necessarily a good predictor.  In the last three weeks, there has been a frenzy of reporting on the momentum of the Obama campaign and the supposedly collapsing campaigns of Mitt Romney and several candidates for the United States Senate.
It is important to remember that prediction markets are just that – markets.  In the same way that polling provides a snapshot of where a particular race stands under a particular pollster’s assumptions, the market prices represent a snapshot of the prediction market’s collective wisdom at a particular point in time.  Just like markets for stocks and residential real estate, prediction markets are subject to what Alan Greenspan in 1996 referred to as “irrational exuberance.”  In that famous speech at the American Enterprise Institute preceding the bursting of the internet bubble and the housing bubble in the next decade, Greenspan asked “how do we know when irrational exuberance has unduly escalated asset values, which then become subject to unexpected and prolonged contractions …?”
Prediction markets generate important “wisdom of crowds” type data, but they are also subject to the “herd mentality” that can substitute objective analysis of underlying fundamentals with an “irrational exuberance.”  Just witness the reaction to rumors of leaked exit polls or unreported precincts and you will understand my point.

I am not saying that the current prices in the InTrade markets will be proven wrong.  I am suggesting that they may be driven by faulty assumptions about the fundamentals of the race.  Traders in these markets are avid followers of polls, rumors and blogs that purport to provide the latest wisdom and narrative.
Perhaps the most pervasive impact on prediction markets come from a poll driven narrative.  That means that polling failures, especially in endemic, will create significant market in the same manner that bad mortgage underwriting led to bad mortgages on over-valued homes or faulty corporate earnings reports led to inflated stock prices.

Let’s face facts.  It’s less likely that the polling data is wrong than it is that the pollsters’ models are wrong in the same way that bad underlying assumptions led S&P and Moody’s to rate packages of subprime mortgages as AAA.

The accuracy of polling in this cycle comes down to their accuracy in projecting the demographic makeup of the electorate.   And this is not just a question of looking at partisan divisions within a particular poll.  It comes down to an even broader set of demographic assumptions about age, sex, marital status, etc.

If you believe that the electorate in 2012 will be more demographically tilted toward President Obama than the 2008 election, then put your money on an Obama victory.  If you think the electorate will look like an average of the 2004 and 2008 electorate then you should be putting your money on Mitt Romney at this point in time. 
 
And as an aside, you should be extraordinarily skeptical of pollsters that just give the top lines from their poll and weave a narrative about the data, but don’t provide you with enough data to evaluate the degree to which their polling tilts one way or the other.

For instance, let’s examine the implications of how you answer the question of what the partisan makeup of the electorate.  The guinea pig for this exercise will be a recent NYT/CBS/Q poll of likely voters gives President Obama a 50%-46% lead in the battle for Virginia’s 13 electoral votes.  The poll numbers contribute to a media and pundit narrative that Mitt Romney is slipping badly or failing to gain traction in the Commonwealth.

A closer look at the polls internals suggest that Democrats could well end up having to call the Virginia electorate stupid.  The poll is based upon a likely voter composition that gives Democrats an 11 point advantage (35D 24R 36 I).  The pollsters could be right, but I’m skeptical.  In 2008, according to exit polls, Democrats enjoyed a partisan advantage of six points (39D 33R 27I).  So if you buy into the argument that the electorate in Virginia will be even more Democrat leaning than in 2008, trust the polls message, because that is what their likely voter sample is saying.

If you don’t buy that assumption, then consider the following table and chart.  The table illustrates what result would be generated using the poll’s internal partisan voting intentions and applying various electoral composition possibilities.   It looks at the 2008 and 2004 electoral compositions and the three points in between.  The result is that President Obama needs an electorate that is significantly more Democratic than the average of 2004 and 2008 to carry Virginia. 

A rough calculation suggests that in order for the President to carry Virginia he need a four points or better Democratic advantage in the electorate.  Why?  In this poll, Virginia independents favor Romney by 53%-42% -- an 11 point margin.  It’s pretty tough for anyone to win an election in Virginia if you lose independents by that margin.
The 2006 Senate exit polls gave Republicans a plus three advantage.  Democratic Senator Jim Webb won narrowly while carrying Independents by a 12 point margin.  I am hard pressed to recall any election in Virginia that was won by someone who lost Independents by double digits.  I’ll be really surprised if that happens in 2012.


State of the Races

Our micro model that examines State level data has President Obama winning a total of 312 electoral votes to Mitt Romney’s 236.  The macro level model gives President Obama a smaller margin of 302 – 236. 

The Republican prospects of taking control of the Senate have declined with the micro model presently projecting a median outcome of 49 seats for the Republicans.  The following chart shows the current probability distribution of Senate outcomes.


Saturday, September 15, 2012

Markets Give Obama Edge ... But Will It Last?

Markets Give Obama Edge ... But Will It Last?

According to the ElectionMarkets.com analysis of data from InTrade on September 14, President Obama currently enjoys the early advantage.  Using the random simulation version of the model based upon state level data, President Obama currently enjoys an Electoral College advantage of 301-237.  That result represents the median outcome of the simulation,  the most frequently observed result was 297-241.
 

Obama wins 89% of the simulations in the September 14 data run.

The macro level model that is based on alternative data from InTrade give Obama an advantage of 298-240.  Obama has a 65% chance of victory under the macro analysis.

Senate Control Sits on a Razor's Edge

The micro-simulation model gives Republicans a 65% probability of holding 50 or more seats after the election.  The most frequently observed result was 50 followed by 51 and 49.


Tuesday, September 11, 2012